Data Visualization with Photoshop: Illustrate Complex Information
A course by Florent LavergneDigital Illustrator
A course by Florent Lavergne, Digital Illustrator

Master the art of creating stunning data visualizations in Photoshop. Learn graphic stylization techniques and develop your own unique visual identity.
Discover the captivating world of data visualization with Florent Lavergne, a skilled digital illustrator renowned for his expertise in the field of data visualization, or dataviz. In this online course, you'll delve into the art of creating elegant and impactful dataviz projects using Photoshop.
Throughout his career, Florent has worked on significant projects like Plastic Pollution and Plants in Danger, shedding light on environmental science—an area close to his heart. His graphics tackle challenging subjects by skillfully contrasting the sometimes harsh data with the delicacy of natural shapes and textures.
In this inspiring course, Florent will guide you through the process of developing a complete dataviz project from start to finish. You'll explore the history of graphical information representation, dive into visualization processes, and get acquainted with the essential tools in Photoshop.
What will you learn in this online course?
25 lessons & 41 downloads
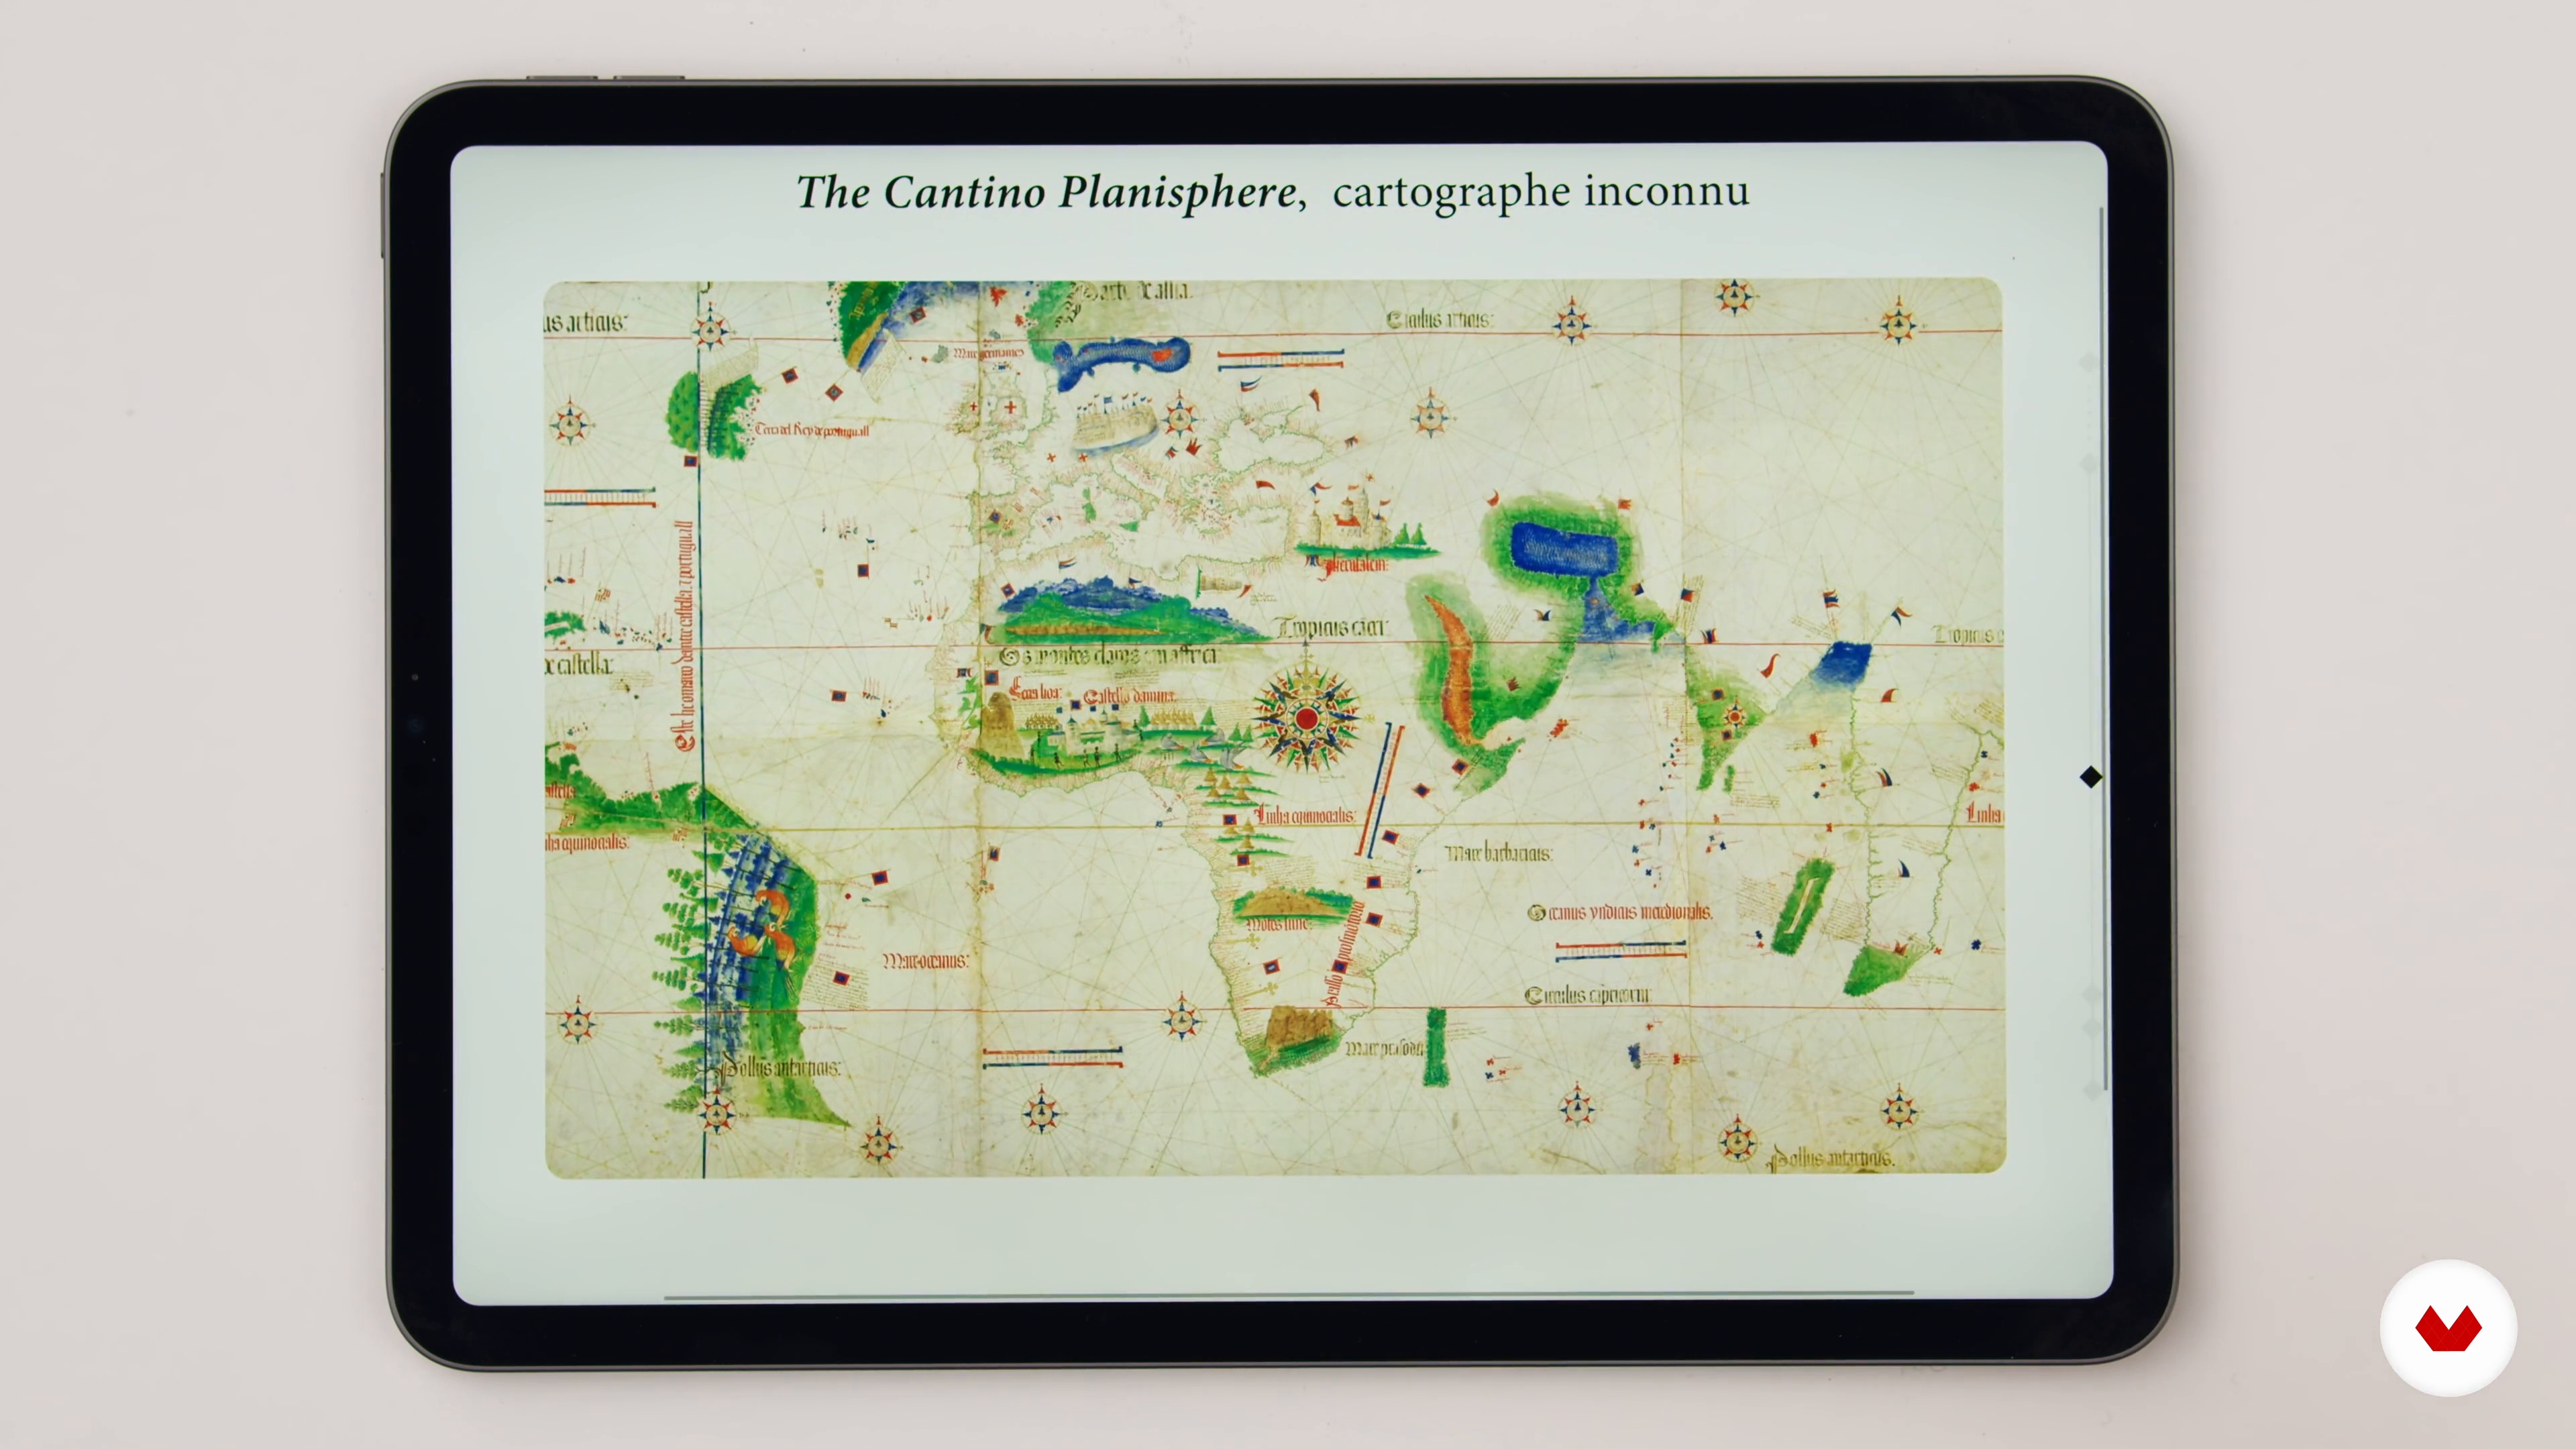
Historique
11 minutes, 21 seconds
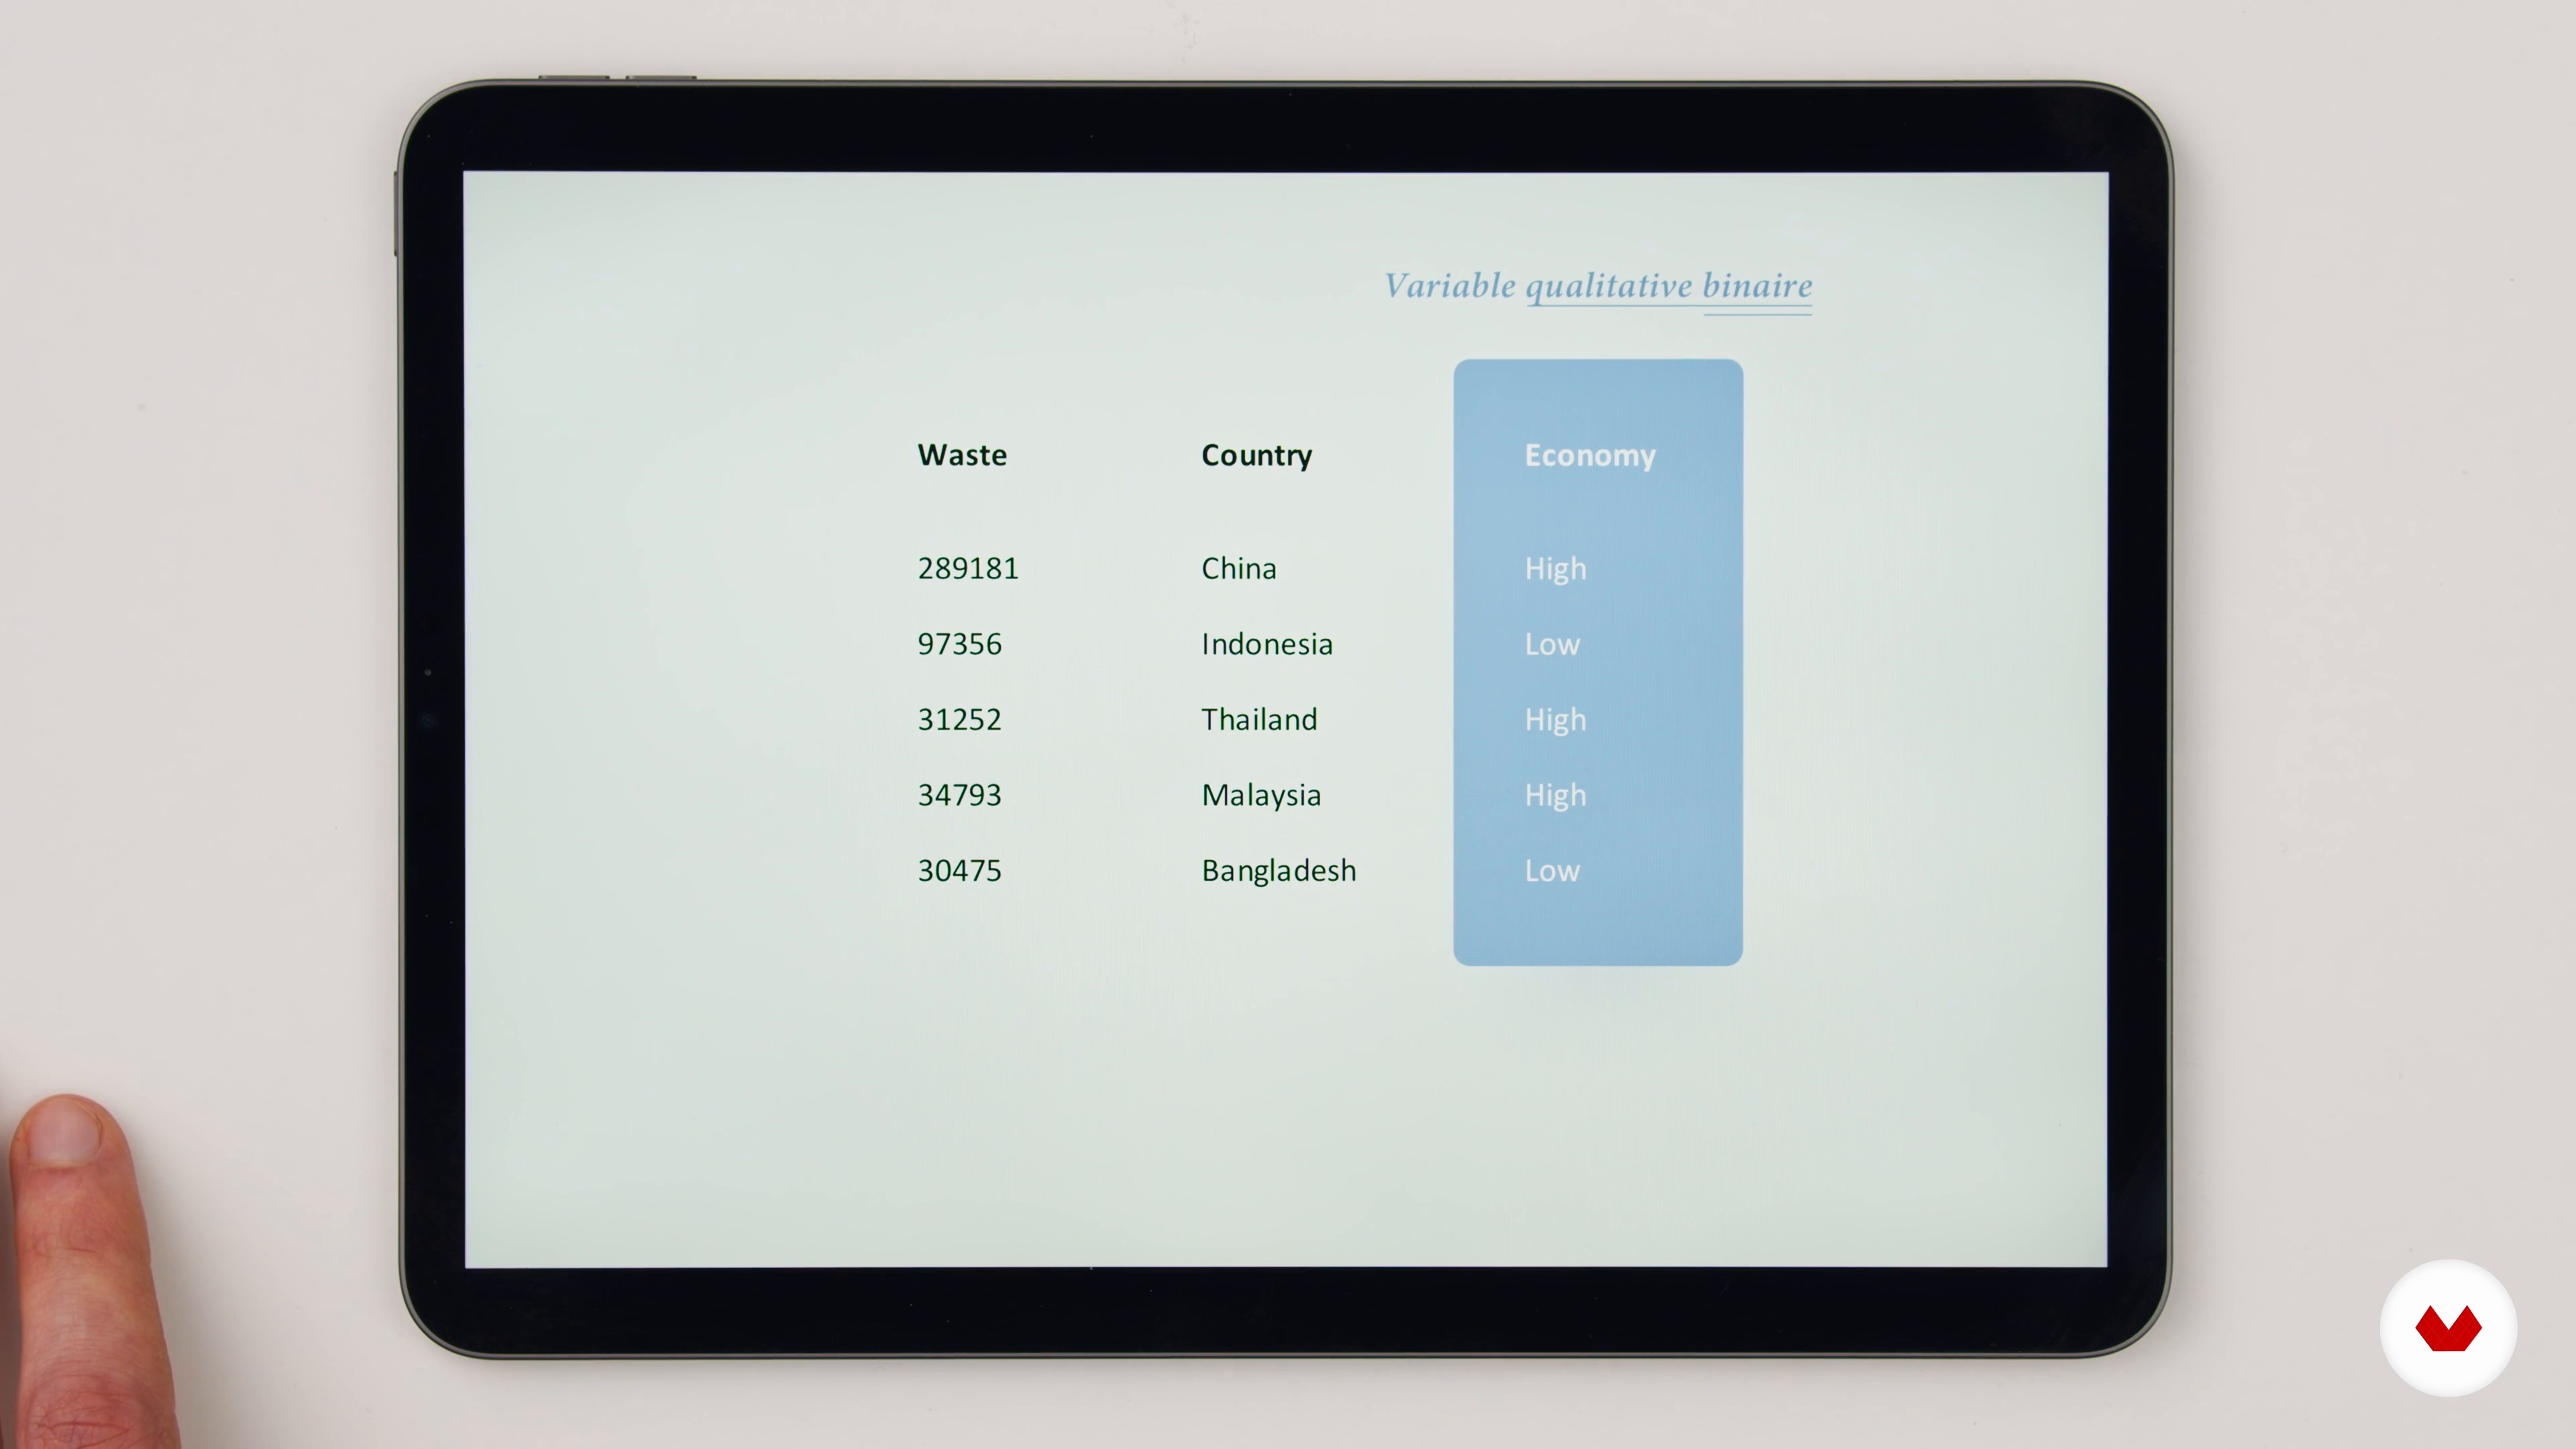
La structure d’un jeu de données
10 minutes, 37 seconds
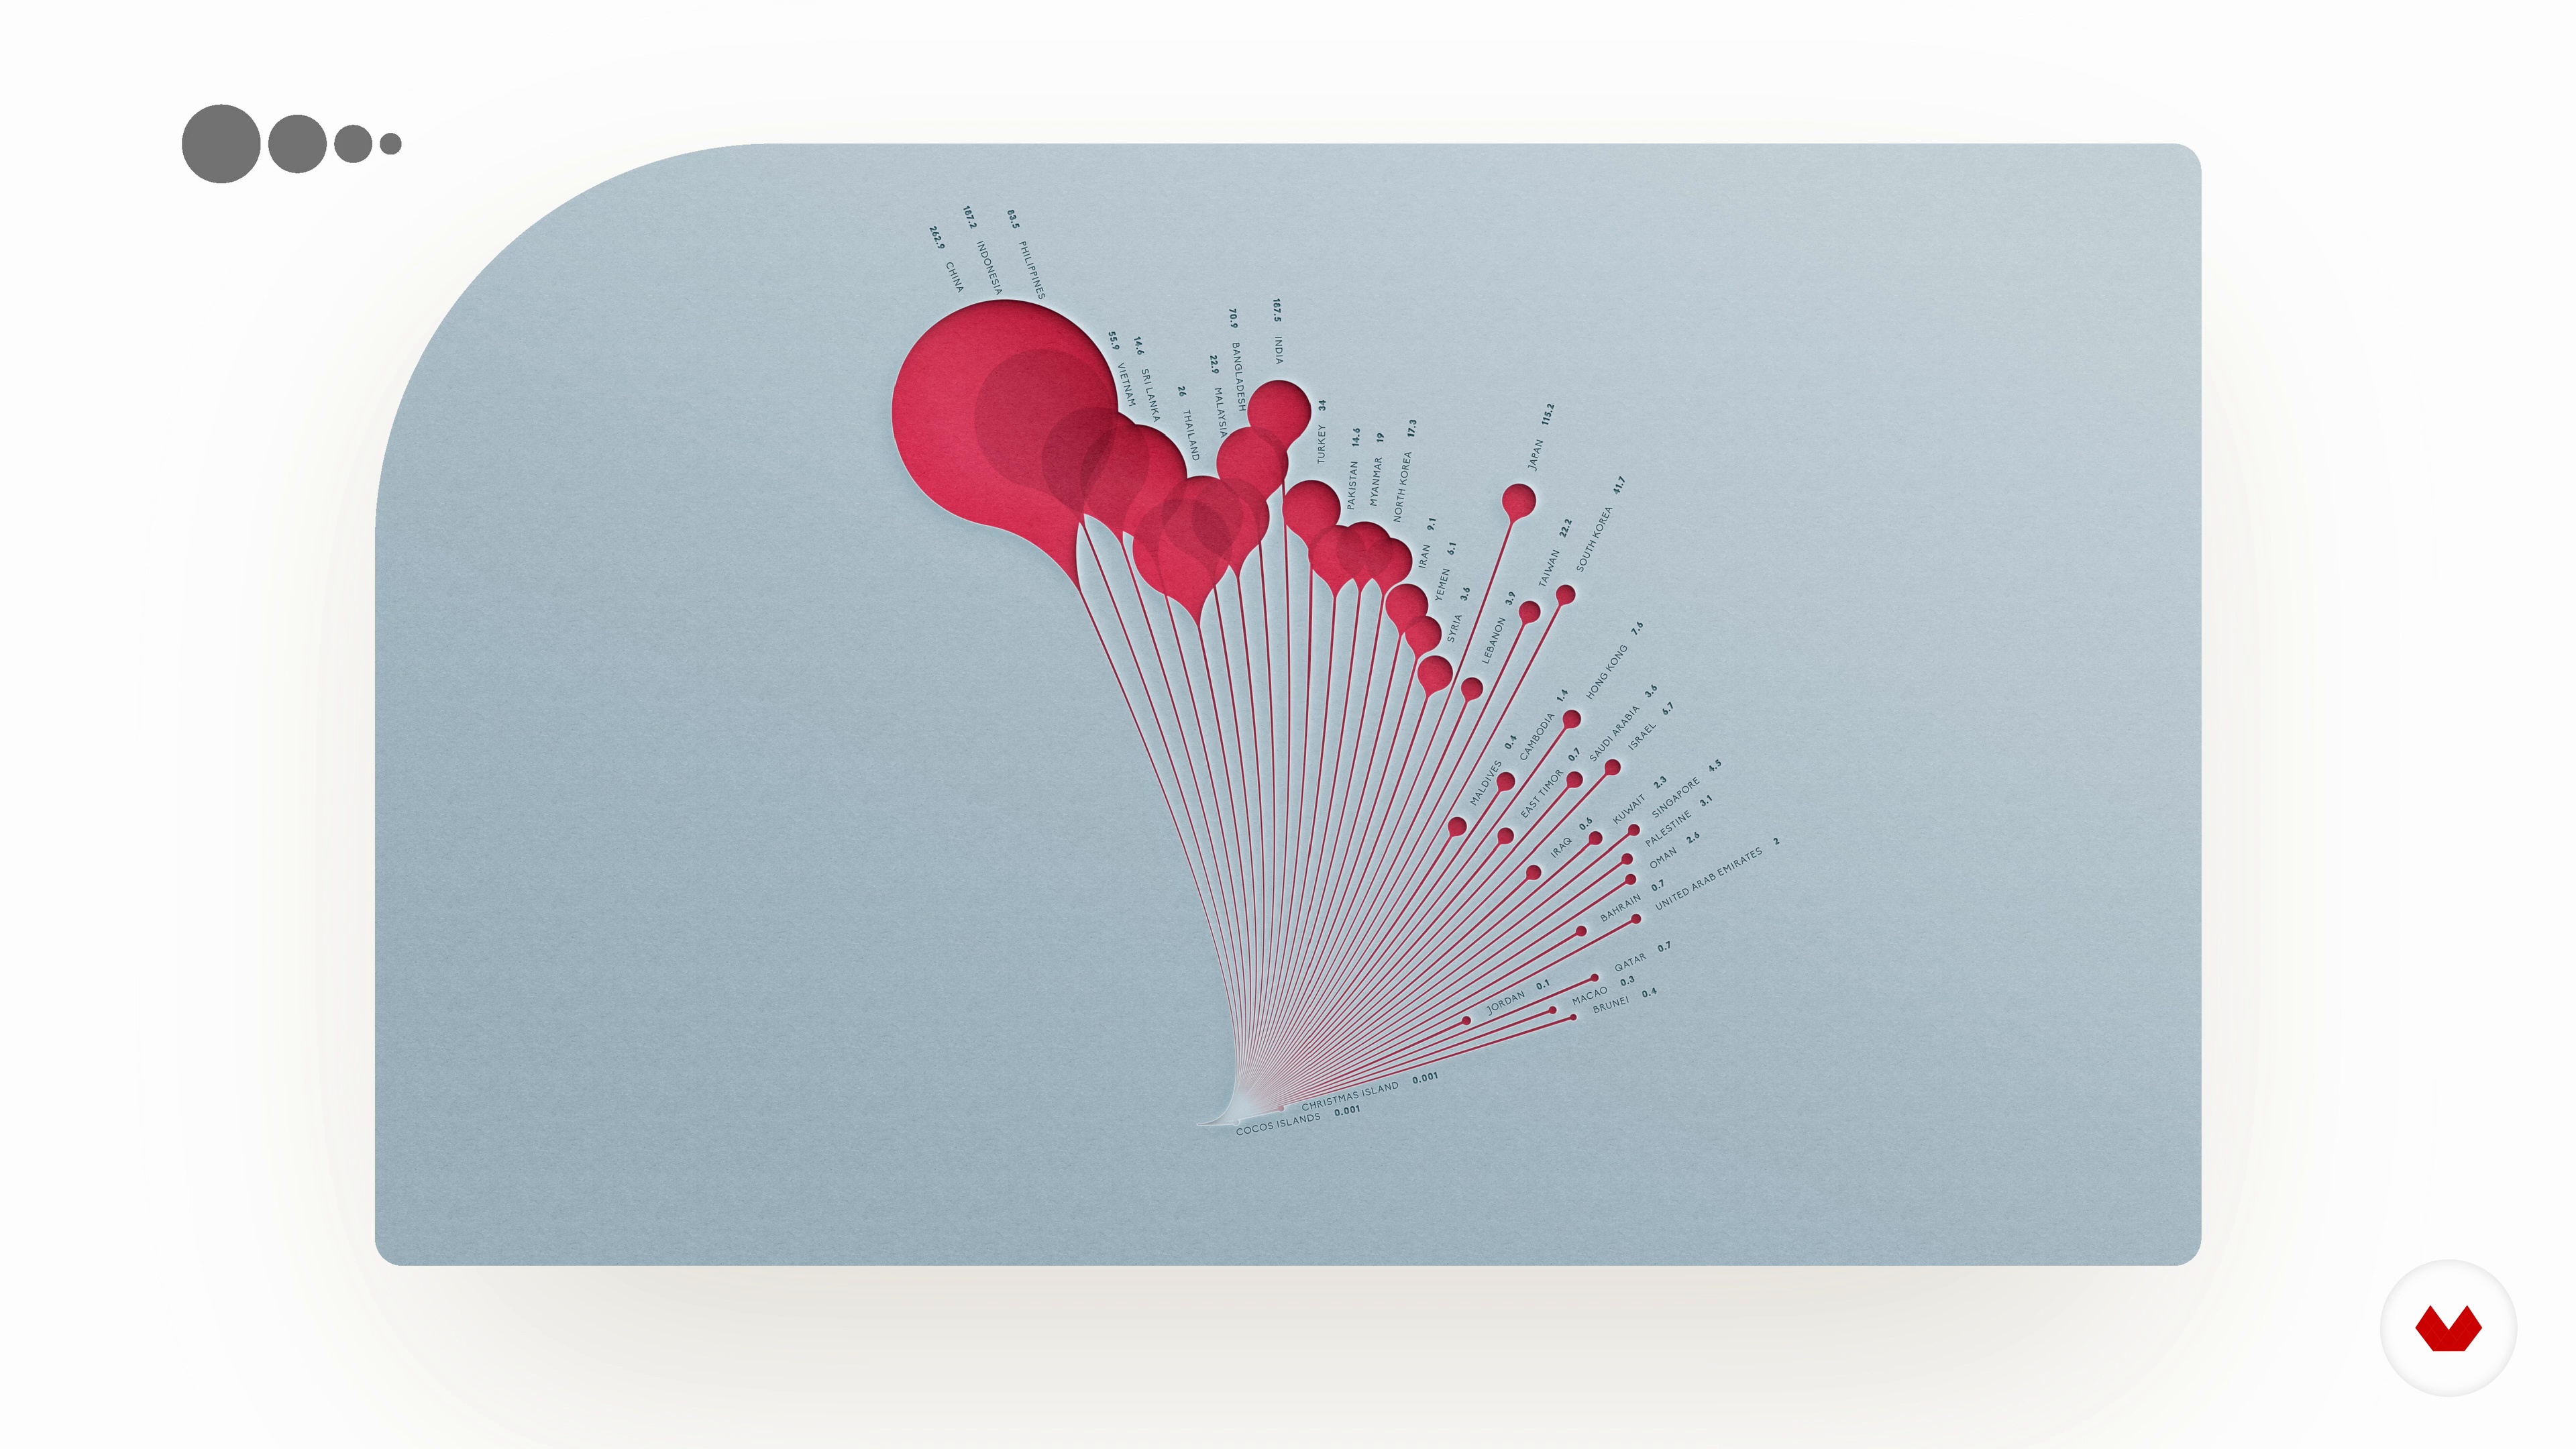
La représentation graphique des données
9 minutes, 25 seconds
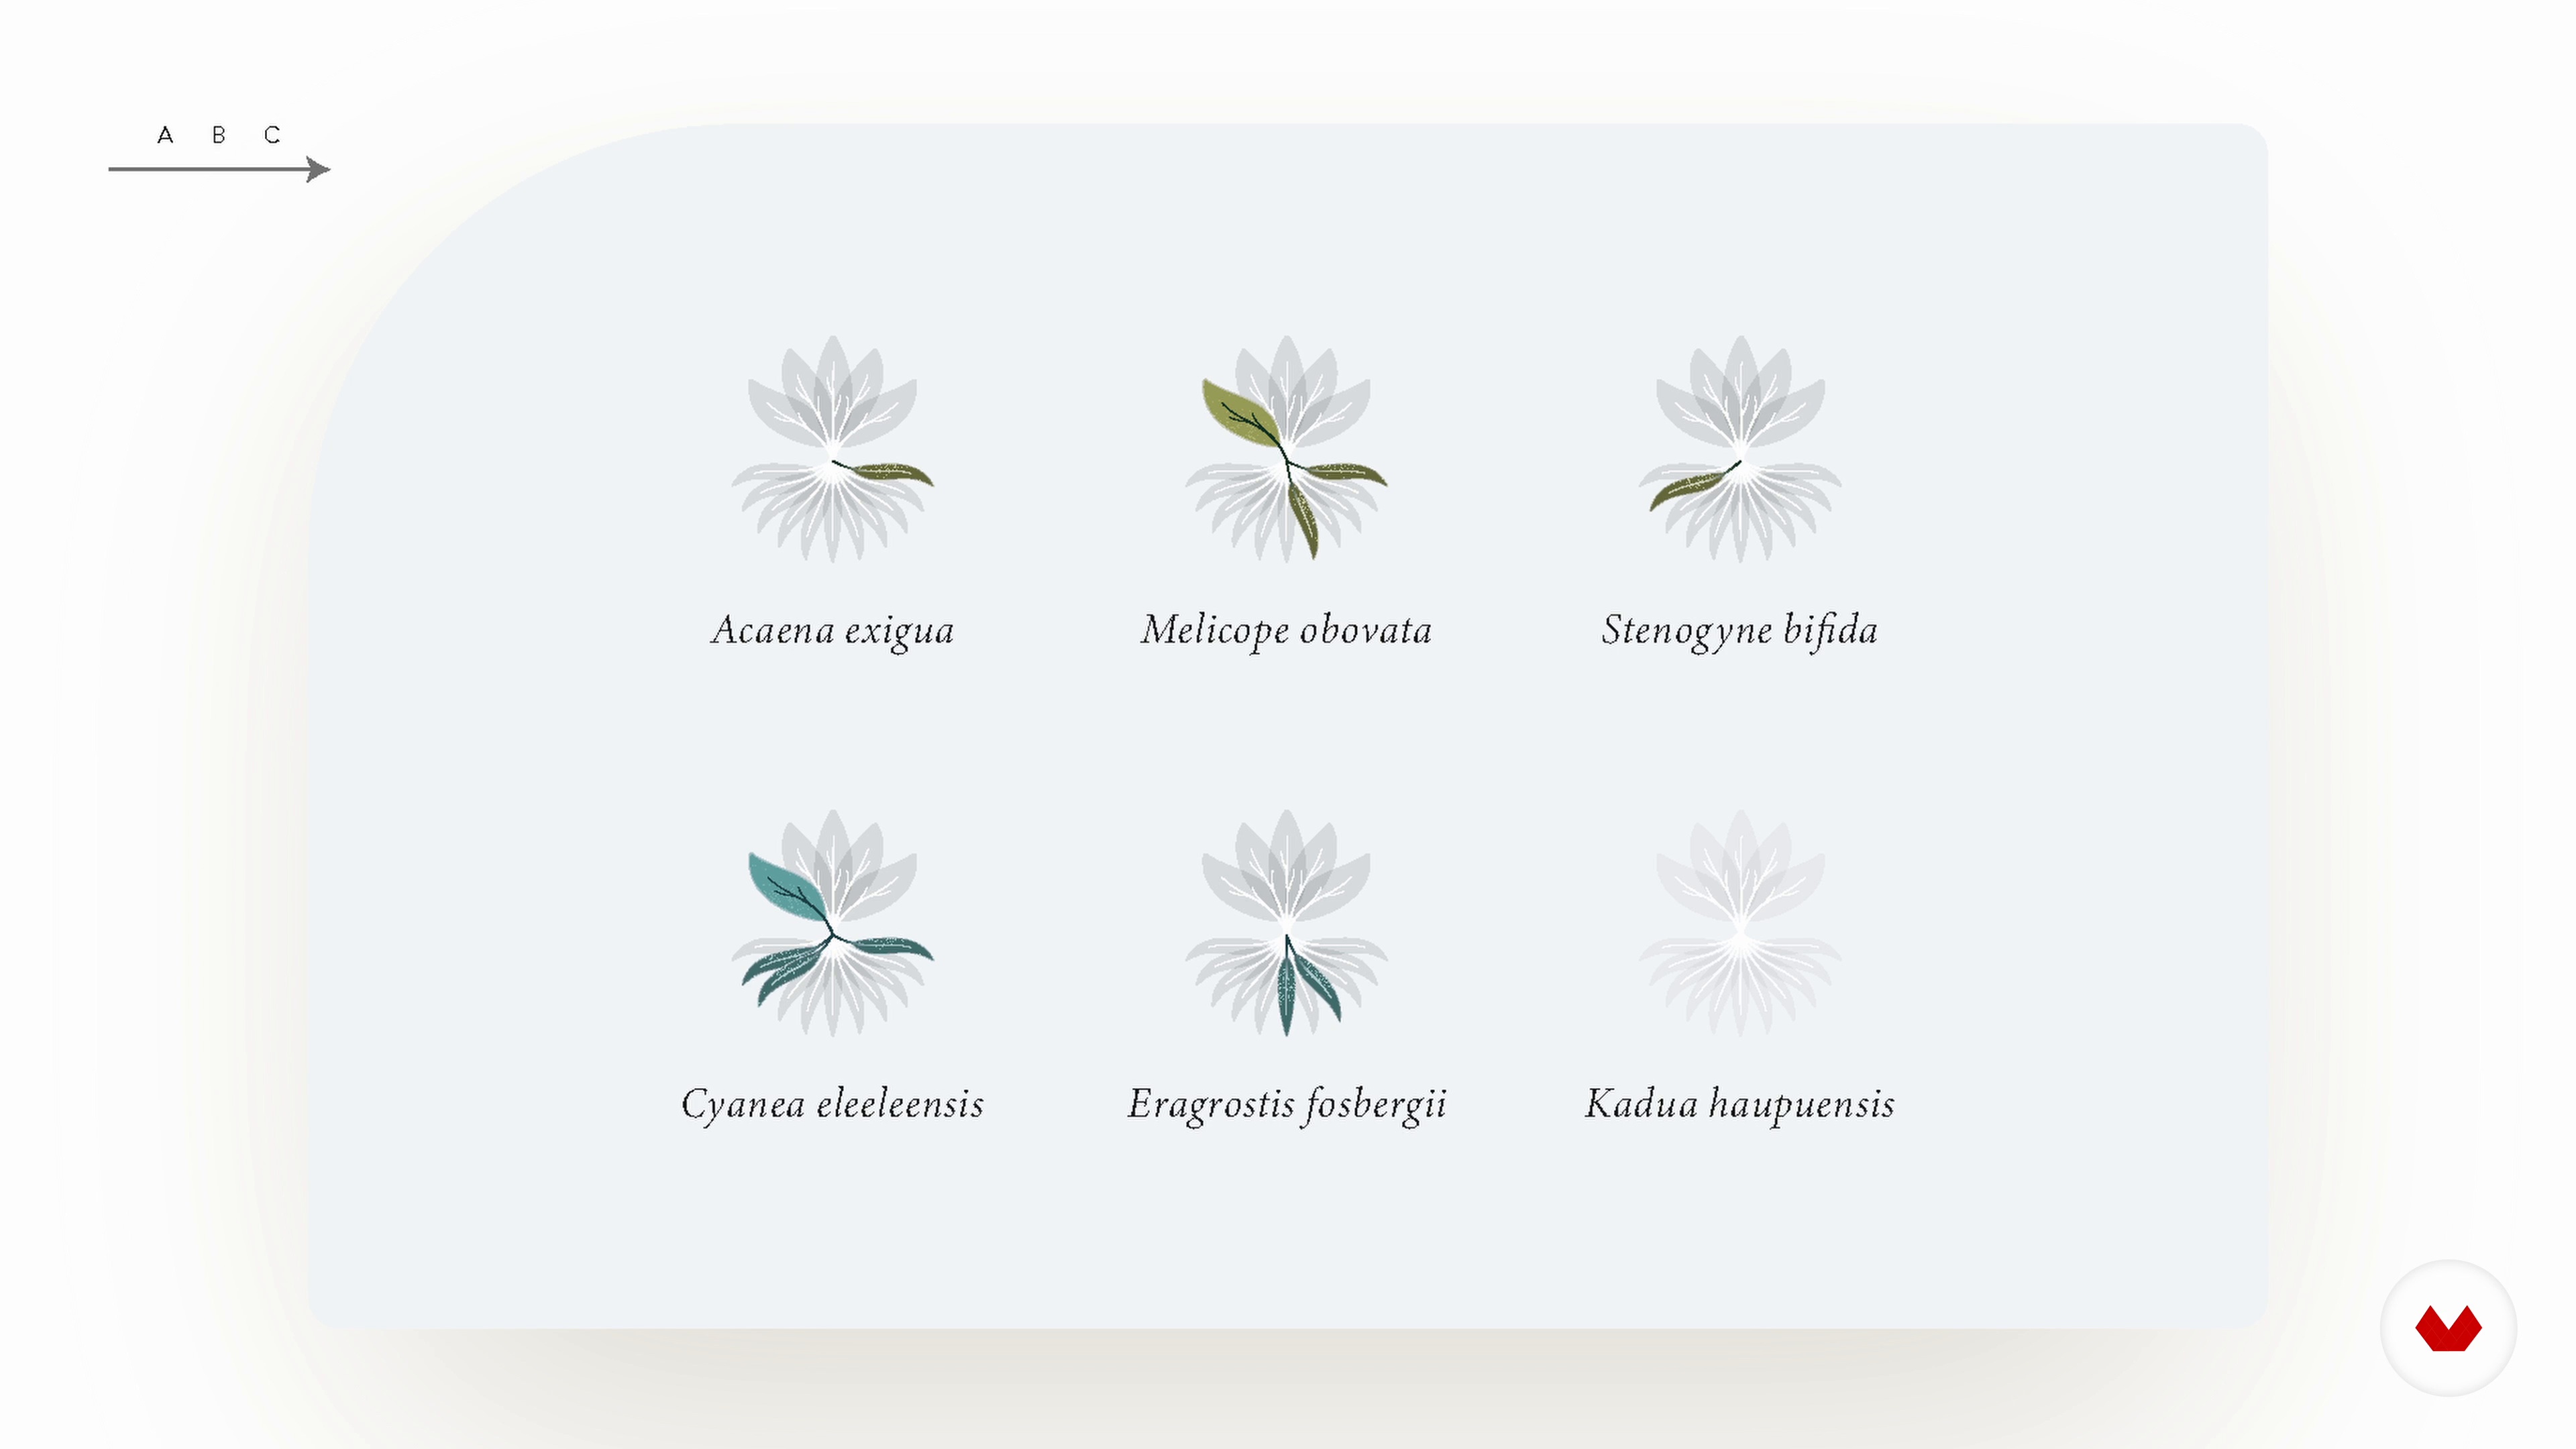
L’agencement du visuel
9 minutes, 9 seconds

Le style graphique
13 minutes, 58 seconds

Esquisser les données
17 minutes, 26 seconds
What's included in this course?
To start, you'll learn the fundamentals of Photoshop and explore creative brush techniques that will breathe life into your dataviz creations. Florent will inspire you to find references from the world around you, igniting your creativity.
Afterward, you'll delve into the fascinating realm of materials and textures. From plastic to wood, metal to stones, crystals to liquids, you'll master the art of interpreting and recreating them in your digital illustrations, adding depth and realism to your work.
Next, it's time to dive into Photoshop's more complex tools, which will allow you to digitally reproduce your sketches with precision and finesse. You'll discover how to organize and texture your elements, refining every detail to perfection.
In the final stages, Florent will show you how to structure and publish your dataviz project online, empowering you to develop your graphic identity and create art that communicates impactful messages with a distinctive aesthetic.
What is this course's project?
Throughout the course, you'll be challenged to create an elegant and original data visualization centered around the theme of extinct plant species. This exciting final project will showcase your newfound skills in interpreting data and rendering captivating visual representations.

Who is this online course for?
This course is tailored for individuals passionate about art, creativity, and data science. Whether you're a budding artist or an experienced designer, if you're interested in combining art and science to convey information with style and impact, this course is for you.
Requirements and materials
To embark on this creative journey, you'll need basic knowledge of Photoshop and access to a digital tablet. A dash of curiosity and inspiration will be your best companions as you explore and recreate various textures and materials in your digital illustrations.

Reviews
- 8 months ago
Great course, taking us through each step and sources of inspiration.
- 9 months ago
Imperdible curso!
- 2 years ago
C'est un super cours inspirant ! L'artiste vous guide pas à pas et explique très concrètement son propos. Un réel plaisir
- 2 years ago
I love the structure of the course
- 2 years ago
I love this course!

With an impressive portfolio featuring projects like Plastic Pollution and Plants in Danger, Florent's expertise lies in finding the perfect balance between striking information and the elegance of visual representation. Join Florent on this creative journey as he shares his knowledge and empowers you to convey impactful messages through data visualization with style and finesse.
Content
- U1
Introduction
- Présentation
- Mes sources d’inspiration
- U2
Introduction à la dataviz
- Historique
- La structure d’un jeu de données
- La représentation graphique des données
- L’agencement du visuel
- Le style graphique
- La boîte à outils
- U3
L’organisation des données
- Filtrer la base de données
- Préparer les données sur Excel 1
- Préparer les données sur Excel 2
- S’inspirer avec Behance
- Esquisser les données
- U4
La stylisation du visuel
- Apprivoiser Photoshop : premiers pas
- Apprivoiser Photoshop : les vecteurs
- Apprivoiser Photoshop : les calques
- Apprivoiser Photoshop : les filtres et les masques
- Importer le texte
- Dessiner les éléments
- Organiser le visuel
- Texturer le visuel
- Coloriser le visuel
- Apporter les touches finales
- U5
Et maintenant ?
- Publier un projet complet
- Se construire à long terme
- FP
Final project
- Datavizualisation artworks: illustrate complex informations
What to expect from a Domestika course
Learn at your own pace
Enjoy learning from home without a set schedule and with an easy-to-follow method. You set your own pace.
Learn from the best professionals
Learn valuable methods and techniques explained by top experts in the creative sector.
Meet expert teachers
Each expert teaches what they do best, with clear guidelines, true passion, and professional insight in every lesson.
Certificates
PLUSIf you're a Plus member, get a custom certificate signed by your teacher for every course. Share it on your portfolio, social media, or wherever you like.
Get front-row seats
Videos of the highest quality, so you don't miss a single detail. With unlimited access, you can watch them as many times as you need to perfect your technique.
Share knowledge and ideas
Ask questions, request feedback, or offer solutions. Share your learning experience with other students in the community who are as passionate about creativity as you are.
Connect with a global creative community
The community is home to millions of people from around the world who are curious and passionate about exploring and expressing their creativity.
Watch professionally produced courses
Domestika curates its teacher roster and produces every course in-house to ensure a high-quality online learning experience.
FAQs
This course is designed for those who already have some experience with Photoshop or data visualization. It’s not strictly for beginners but remains accessible to anyone eager to deepen their creative dataviz skills.
You’ll need a computer with Photoshop installed, an internet connection, datasets to work with, and a strong motivation to explore scientific and creative infographics.
You’ll learn how to analyze and structure data, create visually appealing infographics in Photoshop, apply textures, organize layers, choose color schemes, and publish your projects online.
By the end, you’ll be able to design posters, scientific infographics, or data art, organize datasets, manage complex Photoshop projects, and produce visually striking dataviz.
Yes, the course guides you through creating moodboards, analyzing inspirations, and developing a personal graphic style for your dataviz projects.
You’ll work with both quantitative and qualitative data (like biodiversity, extinction, natural phenomena, open data) and learn how to represent them effectively in graphics.
Yes, you’ll learn how to structure, finalize, and export your work for professional web publishing or conference posters.