
Designing with Numbers: from Data Scraping to DataViz
A course by Luiz LudwigDesigner and Artist
A course by Luiz Ludwig, Designer and Artist

You will learn the fundamentals of data scraping and visualization. You will be able to transform raw data into beautiful insights with ease.
In this online course, you will dive into the fascinating world of Dataviz or data visualization with talented designer and visual artist Luiz Ludwig. Discover how to transform data into creative graphic and interactive pieces, without the need to be a programming expert. Through free platforms, you will learn how to collect and analyze information from HTML pages to create stunning and original Dataviz.
On this creative journey, you will dive into the data scraping process, where the collected data will become a source of inspiration to generate relevant and thought-provoking stories. The final project will be creating a Dataviz themed after the Oscar winners, although you are free to choose another theme that interests you.
What will you learn in this online course?
15 lessons & 15 downloads

Scraping early data from the web
11 minutes, 30 seconds
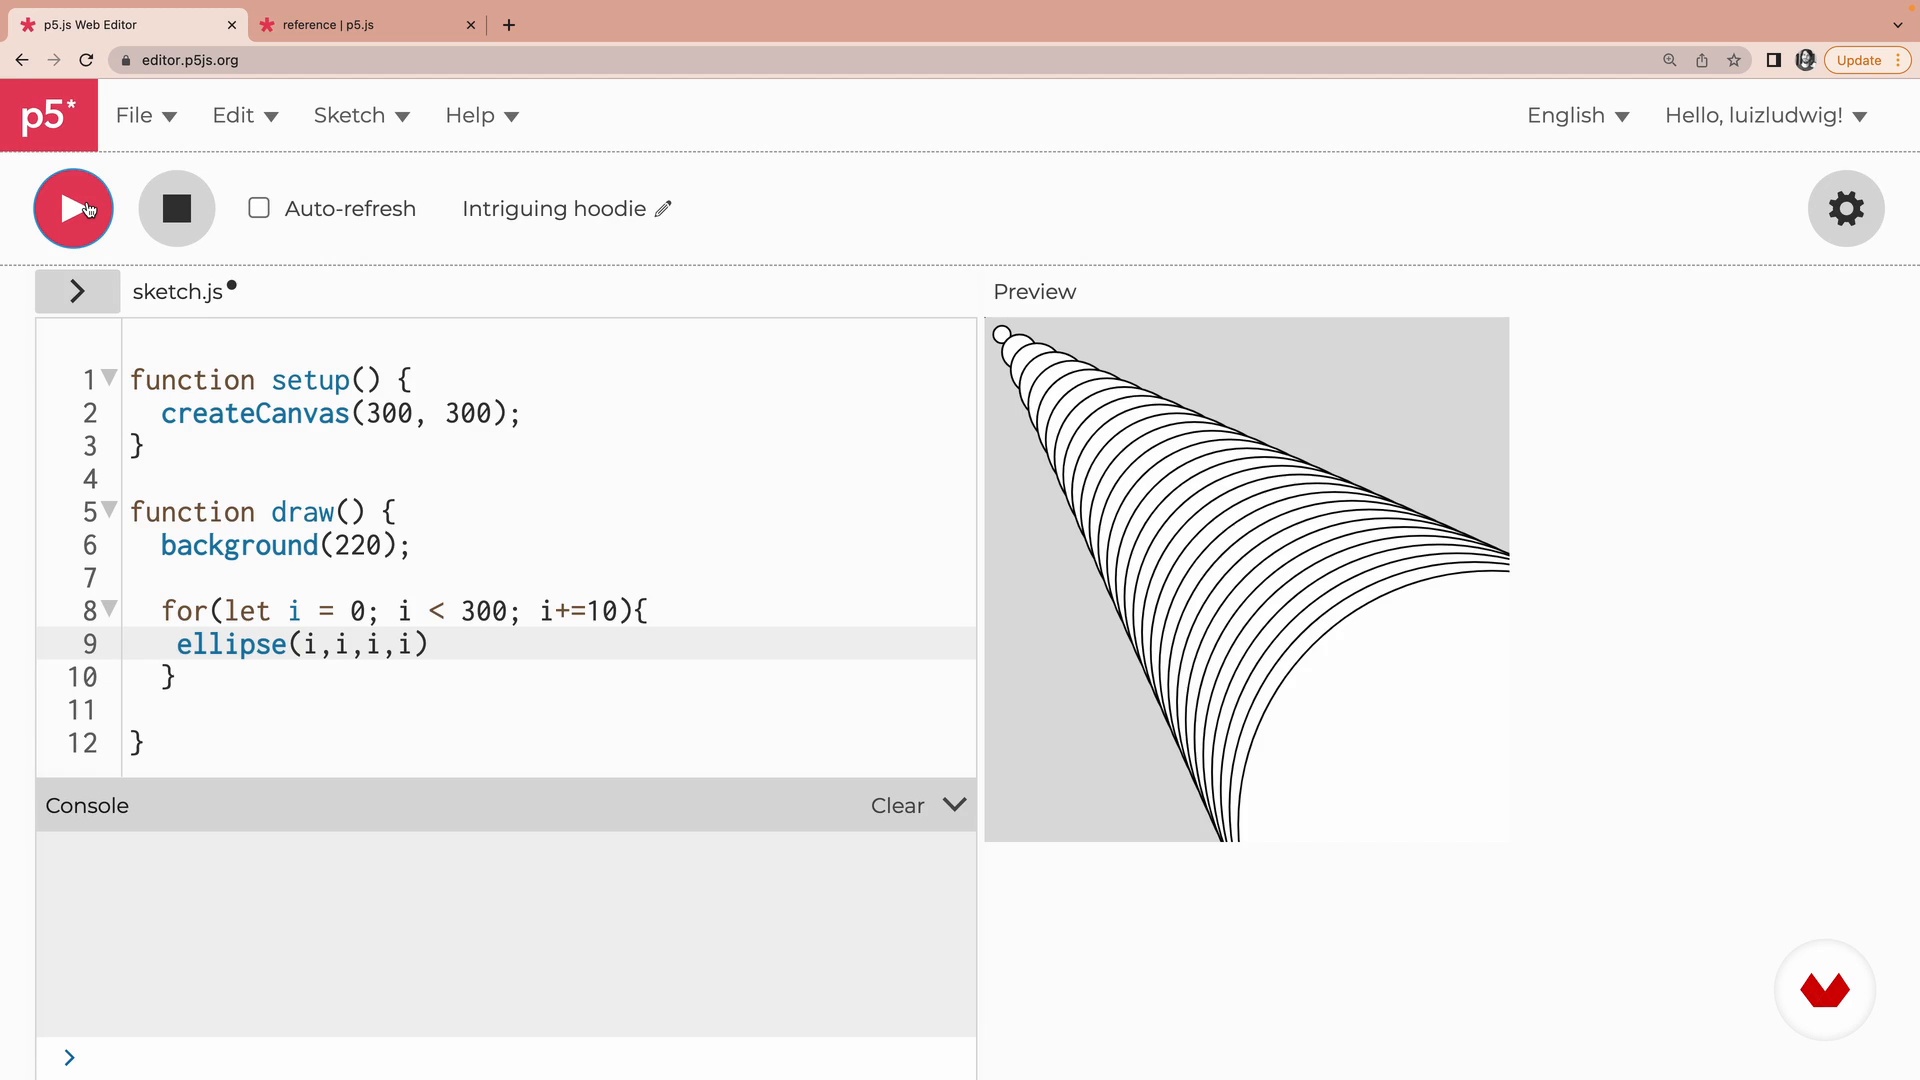
Processing and P5 to create visuals
11 minutes, 2 seconds

Choose a web page
4 minutes, 59 seconds
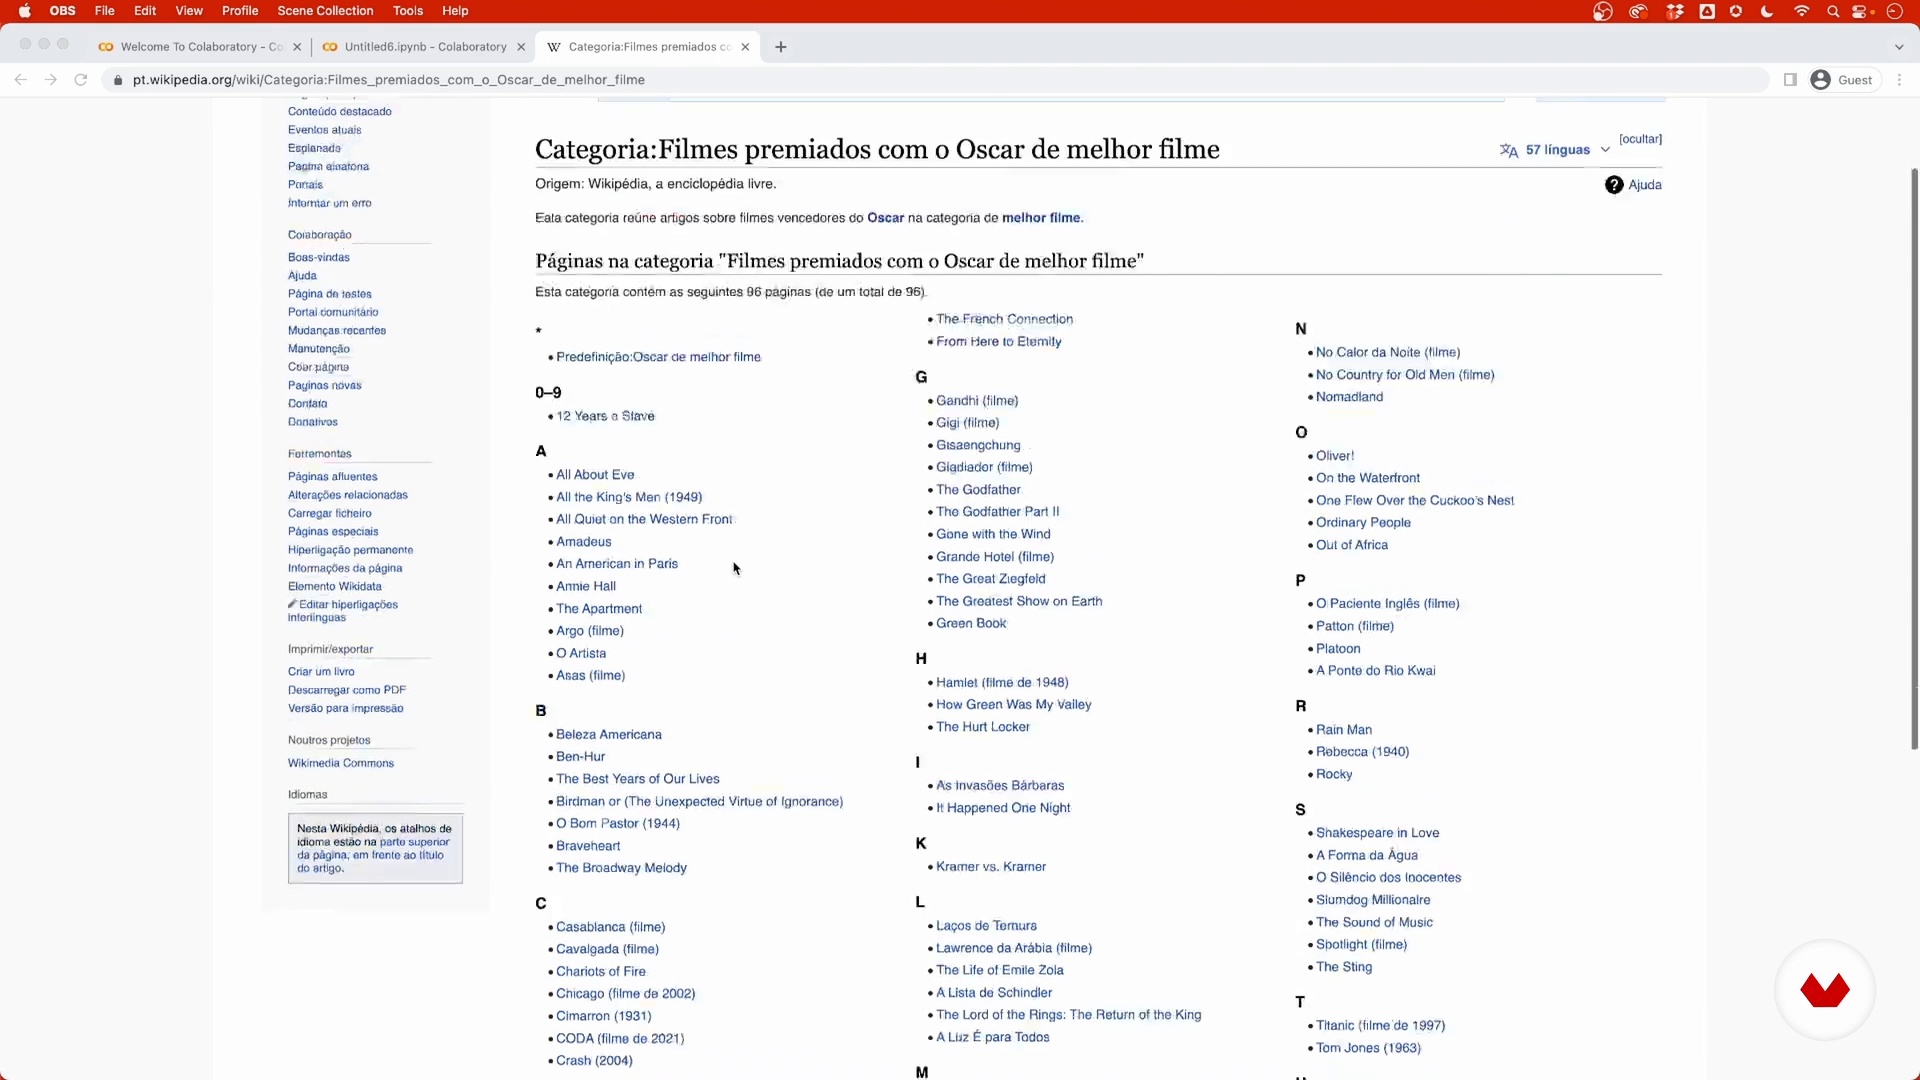
Scrape data from Wikipedia
9 minutes, 39 seconds
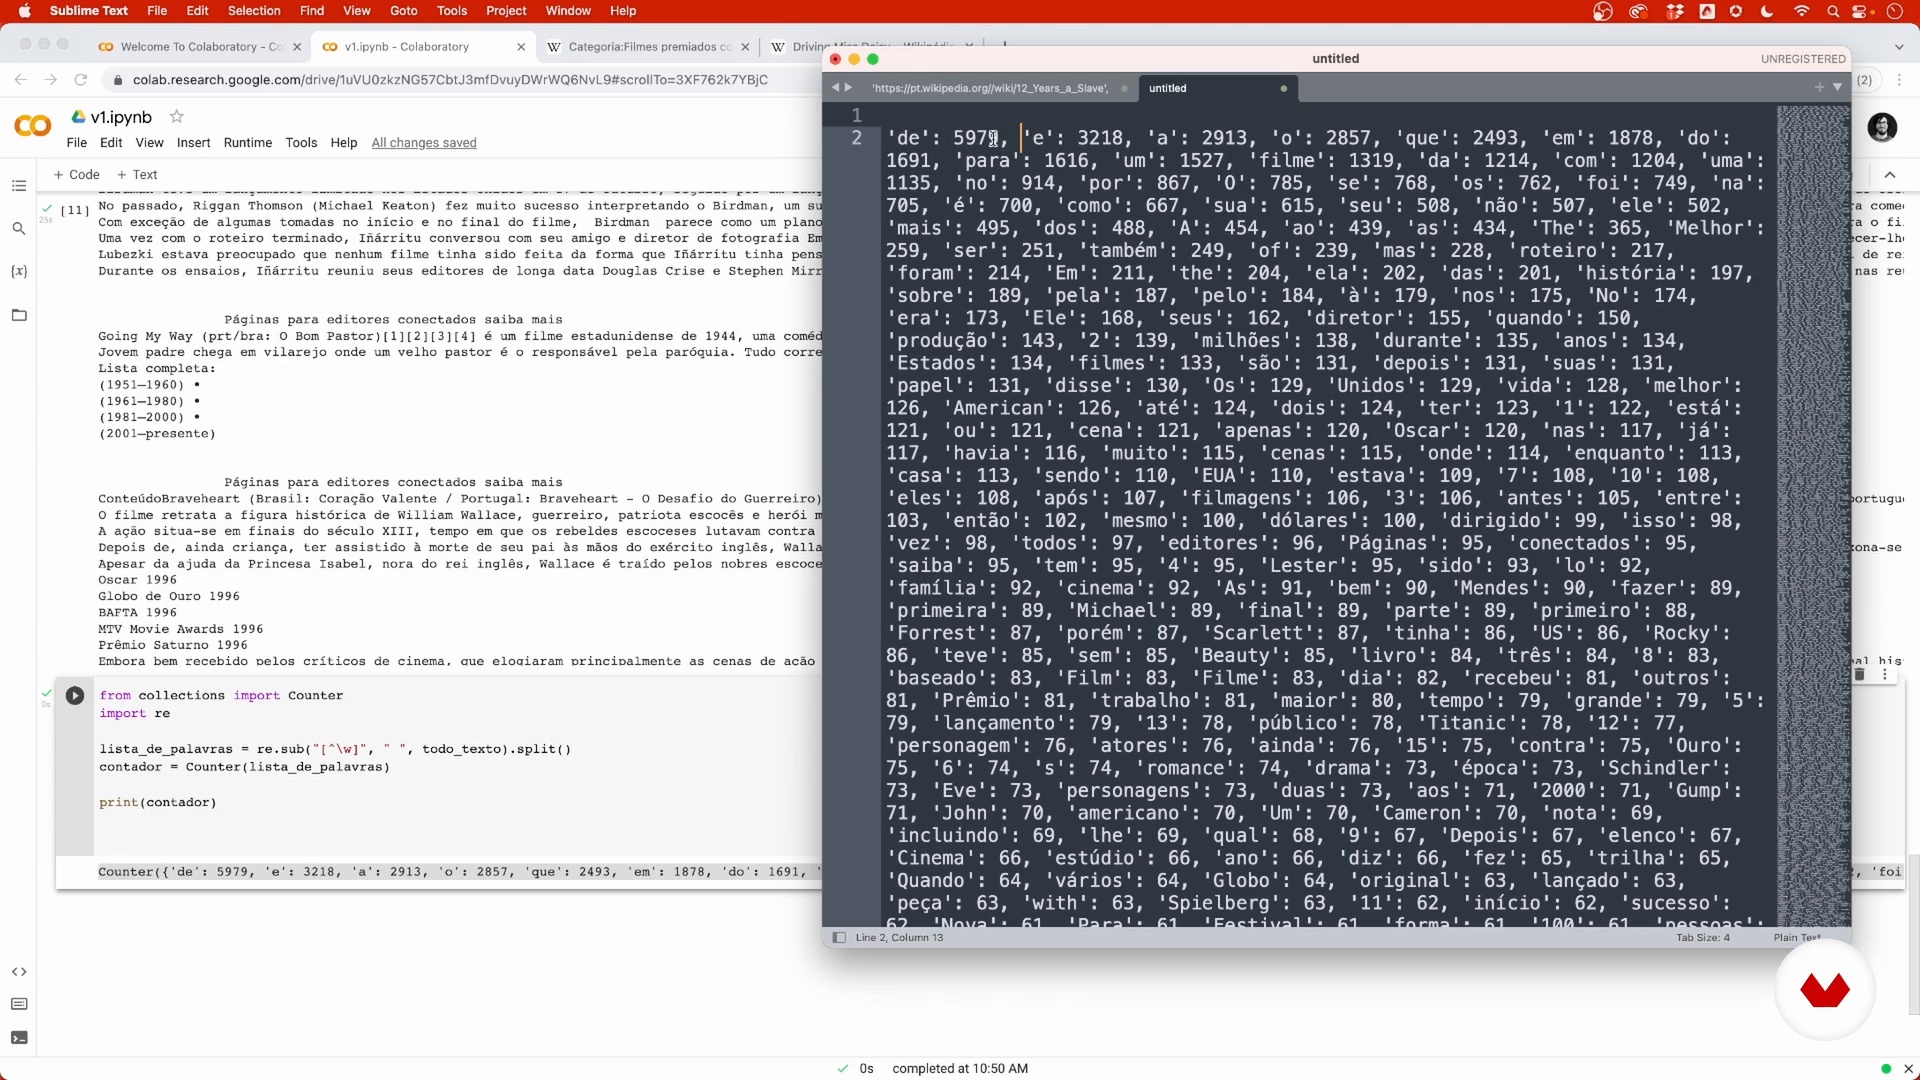
Analyze and clean the obtained data
8 minutes, 14 seconds
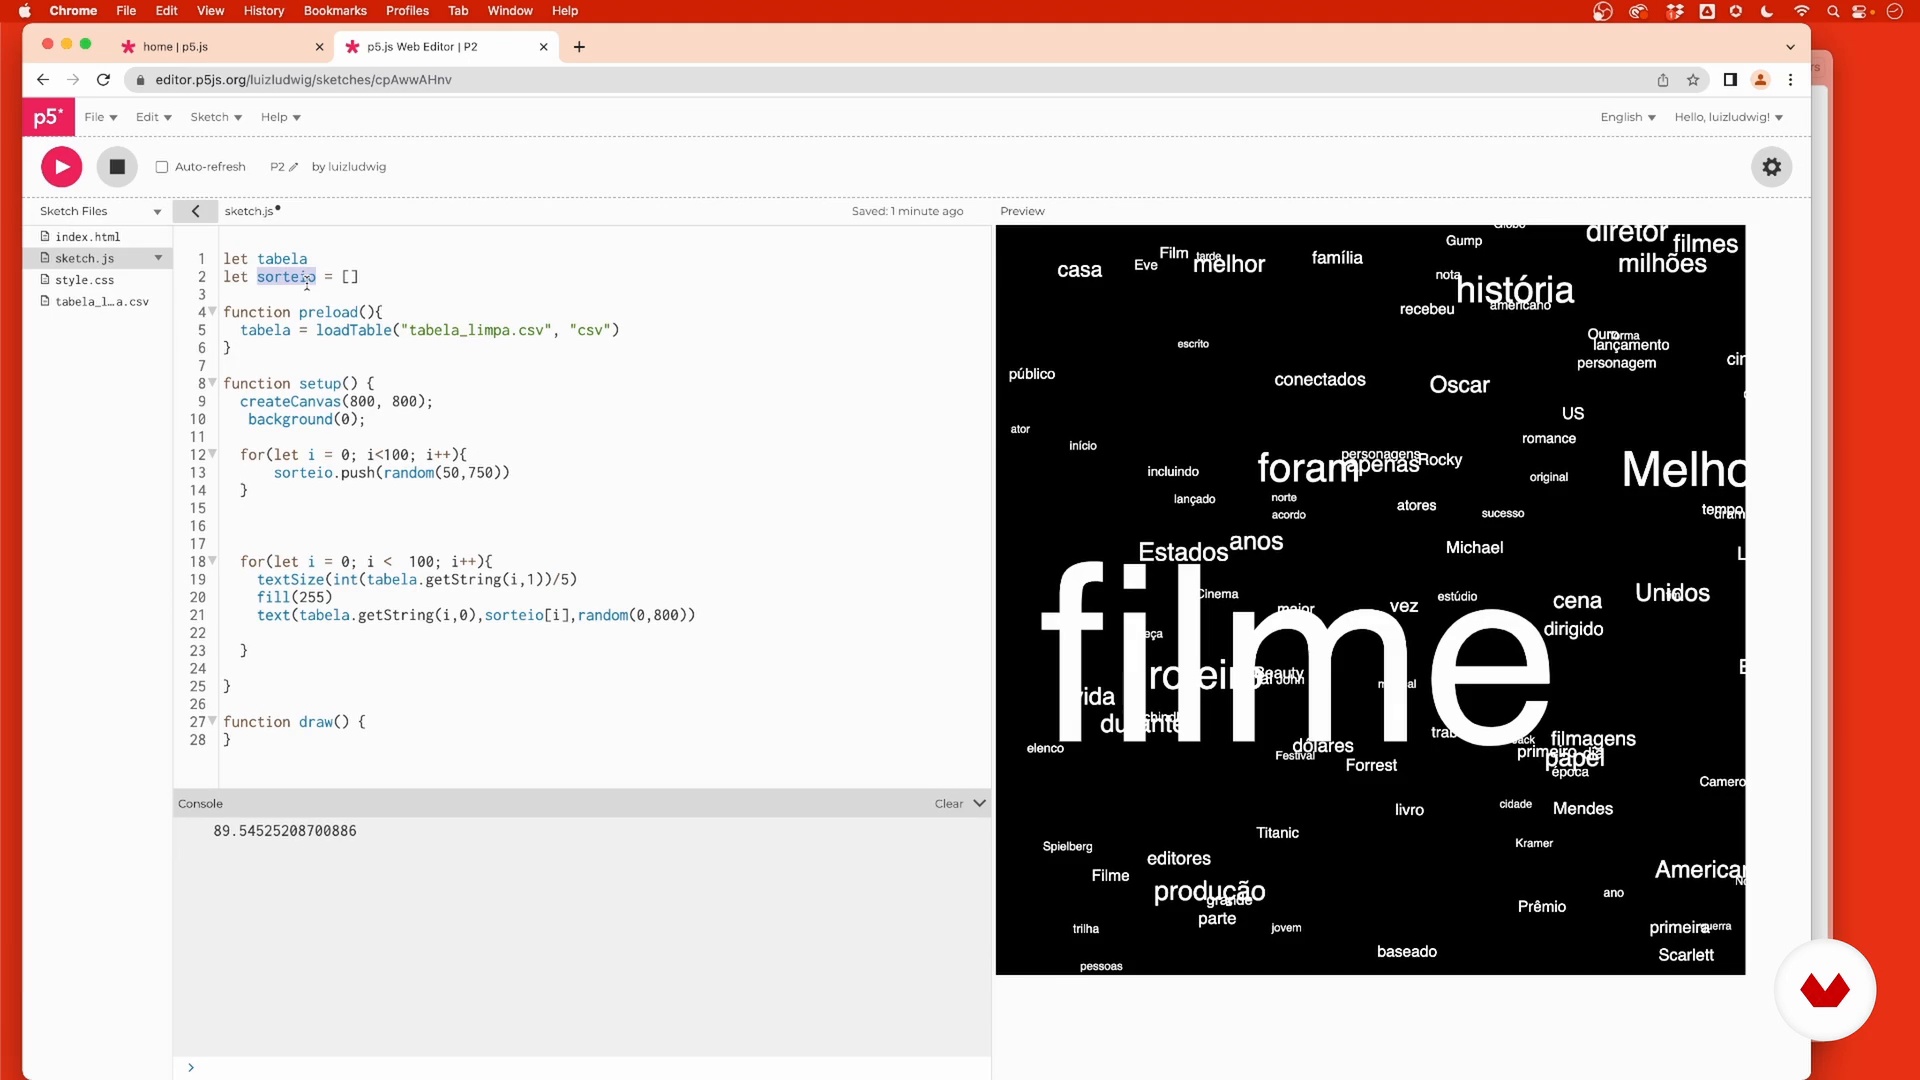
Visualize data with P5
18 minutes, 13 seconds
What's included in this course?
To begin, you'll explore the exciting world of Dataviz and its applications, understanding how data can be a powerful source of artistic expression. You will learn how to use tools like Processing P5 and Google Colab to facilitate data collection and analysis.
You will then dive into the project development process, where you will use a Wikipedia page as a source of information to extract and analyze data. You will choose the best graphical way to present the results and bring your Dataviz to life through refinement and export to HTML.
Finally, you'll discover how to share your work and explore other options for creating data visualizations. Upon completing the course, you will have developed skills to tell visual and informative stories using data science and creativity.
What is this course's project?
The final project is to create an exciting Dataviz, where you will transform data into a unique visualization themed after Oscar winners, although you have the option to choose another theme that piques your interest. Through this challenge, you will put everything you have learned into practice to create a creative and original piece that has a visual impact.
Projects by course students


Who is this online course for?
This course is designed for anyone interested in data visualization and its creative potential. It is not necessary to have previous experience in programming or design, as Luiz Ludwig will guide you step by step through the process. It's ideal for designers, programmers, journalists and anyone who wants to explore Dataviz as a powerful tool for telling visual stories in an original way.
Requirements and materials
To take advantage of this course, you do not need prior programming knowledge. Just make sure you have a computer with internet access to access the free platforms used in the course. With your creativity and enthusiasm, you will be ready to explore the possibilities of Dataviz and create original and memorable data visualizations.
Reviews
- 2 months ago
El profesor lo explica muy bien y es bastante facil de seguir, aunque no sepas programación.
- hgmclcPLUS7 months ago
É um ótimo início para criar um primeiro projeto de visualização de dados! O professor apresenta alternativas tanto para quem gosta de mexer com código, como para quem não tem tanta proficiência!
- 1 year ago
muy bueno para iniciarnos en este viaje
- 1 year ago
Não sabia nada sobre Dataviz e achei interessante a ideia de organizar melhor os dados dos meus trabalhos/estudos e no final achei o curso legal, explica o basico mas da para ter uma ideia do assunto. Talvez uma pessoa com mais conhecimento iria precisar de algo mais aprofundado mas para mim foi bem legal.
- 2 years ago
Muy interesante, me ha descubierto todo un mundo de posibilidades.

Luiz is an expert in using free platforms to collect and analyze data from HTML pages, which allows him to create Dataviz in an accessible and exciting way. With this course, he will share his knowledge with you, teaching you to use data science as a tool to express ideas and generate visual impact. If you are looking to combine programming and art in an incredible match, this course invites you to discover the creative possibilities of Dataviz.
Content
- U1
Introduction
- Presentation
- My influences
- U2
Preparation
- What is web data scraping?
- Scraping early data from the web
- What is data visualization?
- Processing and P5 to create visuals
- U3
Production
- Choose a web page
- Scrape data from Wikipedia
- Analyze and clean the obtained data
- Choosing the view
- Visualize data with P5
- Refine the view
- U4
Next steps
- Share the view
- Other Data Visualization Tools
- Copyright and data owners
- FP
Final project
- From numbers to design
What to expect from a Domestika course
Learn at your own pace
Enjoy learning from home without a set schedule and with an easy-to-follow method. You set your own pace.
Learn from the best professionals
Learn valuable methods and techniques explained by top experts in the creative sector.
Meet expert teachers
Each expert teaches what they do best, with clear guidelines, true passion, and professional insight in every lesson.
Certificates
PLUSIf you're a Plus member, get a custom certificate signed by your teacher for every course. Share it on your portfolio, social media, or wherever you like.
Get front-row seats
Videos of the highest quality, so you don't miss a single detail. With unlimited access, you can watch them as many times as you need to perfect your technique.
Share knowledge and ideas
Ask questions, request feedback, or offer solutions. Share your learning experience with other students in the community who are as passionate about creativity as you are.
Connect with a global creative community
The community is home to millions of people from around the world who are curious and passionate about exploring and expressing their creativity.
Watch professionally produced courses
Domestika curates its teacher roster and produces every course in-house to ensure a high-quality online learning experience.
FAQs
Yes, this course is designed for people with intermediate skills in programming or design who want to deepen their knowledge of data visualization and web scraping techniques.
It's recommended to have basic programming knowledge, especially in Python and programming logic, to keep up with the practical lessons and exercises.
You'll need tools like Processing, Arduino (optional), Google Colab, Python, P5.js, and web browsers for inspecting HTML code. All these tools are free or have free versions.
You'll learn how to collect, process, and creatively visualize data using programming techniques, web scraping, text analysis, and creating interactive charts and layouts.
Yes, the course covers web scraping techniques with Python, including using Beautiful Soup, Requests, and Google Colab, as well as how to collect, clean, and organize data from HTML pages.
Yes, the course teaches how to build interactive data visualizations using Processing and P5.js, exploring shapes, colors, mouse interactivity, and exporting graphics.
Using Arduino is optional. It's introduced as a complementary resource for specific projects but isn't required for most course activities.